Part 1 – introduction and techniques
Brain imaging has advanced massively in the past two decades. Modern tools such as positron emission tomography (PET), magnetic resonance imaging (MRI) and Magnetoencephalography (MEG) allow us a much clearer view of how the brain works: we can almost literally “look inside the skull”. This article introduces the different forms of imaging and give examples of how we can use them to ask important questions in psychiatry and neurology.
What techniques do we have?
We can consider imaging techniques from several perspectives. One is based on the detection instruments or technology used. Another is the kinds of signal that can be detected whether structural or functional or metabolic and yet another approach is to explore what they can be used for.
Fig. 1
A PET scan of a GABA-A receptor subtype [the alpha5]
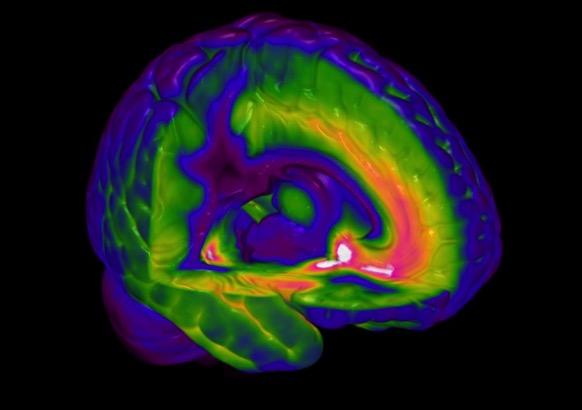
PET = positron emission tomography and its close cousin of SPECT = single photon emission computerised tomography – are used to explore brain activity and drug binding and thereby receptor localization.
These techniques use radiolabelled tracers such as 11Carbon or 18Flourine for PET or 99Technecium metastable (99Tcm) or 123Iodine for SPECT. These unstable radionuclides decompose in the brain giving out 2 gamma rays in the case of PET or a single photon in the case of SPECT and these electromagnetic rays are detected by sensitive photocells arrange in a ring around the head. These techniques can be used to explore changes in either blood flow [eg with 15O water or 99TmHMPAO] or in cellular metabolic activity [using the uptake of 18F-deoxyglucose that enters cells in proportion to the usage of glucose in them].
In some cases it is possible to attach a radioactive nuclide to a drug and so measure its entry and distribution in the brain. If the drug has high affinity for a receptor/reuptake site/enzyme then the density of these can be estimated in discrete brain regions from the radioactive signal in each – fig 1. Currently we have good tracers for estimating the density of a number of receptors for the dopamine 5-HT and GABA-A systems; these are described in more detail in part 2. The time resolution of the PET/SPECT signal is in the order of minutes.
Fig. 2
The structure of a normal human brain revealed by MRI
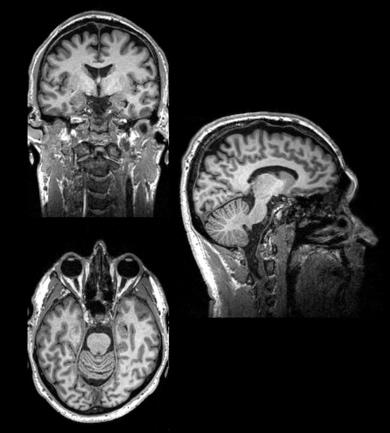
MRI = magnetic resonance imaging – is used to analyse brain structures.
MRI is a technique that relies on having hugely powerful magnetic fields that are used to align molecules of water and other brain components that have paramagnetic properties. The alignment of these molecules is perturbed by pulsing radio waves from electromagnetic coils [head coils] into the brain, and measuring how they return to their prior alignment. This can give a number of measures of brain structure based on the water or fat content of different regions [often called structural imaging] fig 2. This is used to help make diagnoses in neurological and psychiatric disorders eg stroke and dementia. It is also a vital tool in helping identify the brain regions that are identified in other forms of scanning such as fMRI and PET. Depending on the magnet strength [stronger is better] and duration of scanning [longer is better] resolutions of millimetre scale can be obtained – so allowing analysis of specific sub fields of brain regions eg hippocampus.
fMRI = functional magnetic resonance imaging – is used to evaluate the brain regions engaged in specific tasks.
FMRI uses the change in magnetic properties of haemoglobin after it loses it oxygen atoms to measure alterations in local blood supply [often called the BOLD signal – blood oxygen level dependent signal]. The time resolution of the BOLD signal is in the order of several seconds. This is the workhorse for modern neuroscience research that wishes to understand the regions of the brain engaged in specific tasks. For this reason some have dubbed fMRI the new phrenology! As brain regions are engaged in a task then the bold flow increases and this changes the magnetic signal in that region. Moving a thumb repeatedly will increase the BOLD signal in the motor cortex for example. FMRI can look deep into the brain so investigate regions that had previously been inaccessible. One of these widely studied is the amygdala where fearful images will reliably produce an increase in BOLD signal. One recent use of fMRI BOLD is to test if people who are in a coma have a degree of consciousness; they can be asked to imagine playing a sport and if the motor cortex then shows increased BOLD activity we can infer they are conscious.
phMRI = pharmaco-MRI – is used to map brain function in response to a pharmacological stimuli.
With this technique the change in signal [usually BOLD but can be ASL (arterial spin labelling) and even MRS (magnetic resonance spectroscopy)] is used as a measure of drug effects in the brain. This is a growing field for psychopharmacology research as many drugs alter BOLD activity in some brain regions. So for example benzodiazepine receptor agonists have been shown to decrease cortex activity in the human brain through enhancing GABA inhibition. The SSRI-induced release of prolactin was found to correlate with increased BOLD signal in the hypothalamus. The study of drug effects on resting state BOLD activity [described more in part 3] is providing some unique profiles into the differences between different classes of drugs.
Fig. 3
An MRS recording - peaks give a measure of the concentration of different substances
This fig shows a spectrum analysed in such a way as to enhance the signal from the specific resonances in the GABA molecule. The area under the GABA peak represents its concentration in the large occipital voxel shown. Other peaks can be defined that represent other molecules such as glutamate, creatinine, choline and N-acetylaspartate.
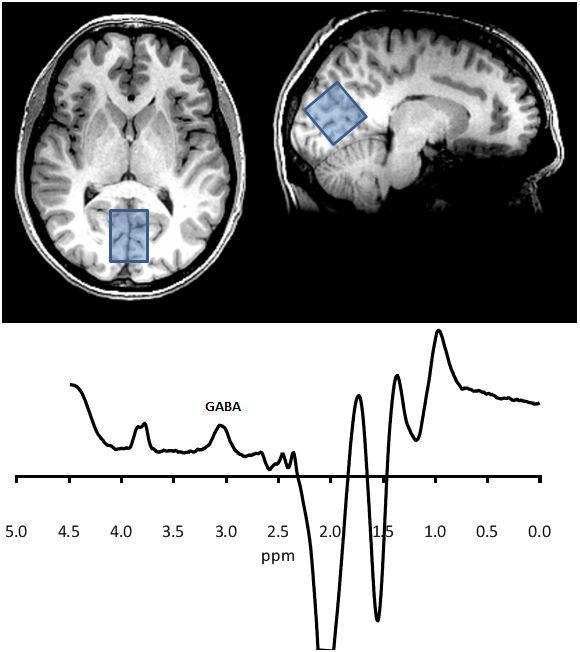
MRS = magnetic resonance spectroscopy – is used to measure biochemical changes in the brain.
MRS is used to measure the concentrations of certain biological molecules in the brain. The atoms within these molecules resonate at specific frequencies according to the specific bonds between them, so each has its own fingerprint within a larger spectrum. Higher magnetic field strengths improve the resolution of the spectrum, but overlap of the signals of various molecules usually means scanning a large voxel (approx 25 cc) for about 10 mins.
Here we can measure levels of certain metabolic substances such as NAA (n-acetylaspartate) and creatinine and glutamate/glutamine. At high magnet strengths, e.g. 3 Tesla and above then other substances such as GABA can be measured, Fig 3.
Currently the clinical applications of MRS are limited but it is used to explore changes in metabolic pathways e.g. in dementias and in some genetic disorders. Alterations in brain glutamate have been detected after some drug treatments e.g. with the glutamate receptor blocker ketamine.
ASL = arterial spin labelling - is used to measure cerebral blood flow.
In ASL a magnetic pulse is applied to the blood flow in the carotid arteries. This orients the oxygen atoms in the haemoglobin and as they leave the carotid artery and enter the brain this orientation decays and this provides a signal of the amount of blood flow in a given voxel.
ASL is often used in pharmacological MRI experiments to ensure that there is no direct effect of drugs on blood flow that might confound interpretation of the effects on the BOLD signal. However for some drugs a regionally specific ASL signal can provide clear measures of drug actions. Examples of this are given in part 2.
DTI = diffusion tensor imaging – is used to measure the brain white matter tracts.
DTI uses MRI tuned to measure axonal tracts in the brain. They can do this because the movement of water in nerve axons is constrained by the fatty sheaths of the neurons so is less perturbed by the radio-pulses than the rest of the water molecules in the brain.
Fig. 4
Brain axonal pathways revealed by DTI imaging

Fig 4 gives an example of how this approach can provide beautiful images of the fibre tracts in the brain. Though in its infancy DTI is beginning to be used as a research and diagnostic tool since it measures are capable of quantification and so can be subject to statistical comparisons.
MEG – magnetoencephalography – is used to measures electrical activity of the brain.
MEG assesses the magnetic fields that neuronal electrical currents produce. These magnetic detectors are called SQUIDS (superconducting quantum interference device) and usually 128 and often more of them are arranged in a head-covering shell that can be lowered onto the person’s head. MEG has a very fast time resolution of a few milliseconds. MEG can only reliably measure activity in the cortex but has the advantage of being less susceptible than EEG to artefacts from head muscle activity that badly interfere with the high frequency [>30hz] EEG signal. Fig 5
Fig. 5
The principles and practical use of MEG
EEG – electroencephalography – is used to measures electrical activity if the brain from a series [often 64 or even 128] surface electrodes.
EEG has a very fast time resolution of a few milliseconds and is generally assessed in terms of activity in a range of different frequency bands ranging from 1-3 hz [delta] 4 -8 hz [theta] 8-12 hz [alpha] and 13 —30 hz [beta], though the high frequencies are susceptible to artefacts from electrical activity of muscle so are less reliable than those from MEG. EEG was the first brain imaging technique and has a long track record as a diagnostic tool for identifying epileptic foci. It is also a vital tool for assessing the different stages of sleep each of which have a clear and discrete EEG profile.
PET and MRI techniques have the drawback [at present] of requiring the person to be lying down and having their head in a deep tube can be claustrophobic for some anxiety-prone people. MEG and EEG (electroencephalogram) are used in the sitting position so more comfortable for patients and are better for studies where real-world types of interactions are desired eg performing tasks on a computer. Nevertheless people have become very clever in adapting research tools to apply in the flat-scanner environment and it is now possible to have subjects interact with videos and computers using projectors and mirrors. One Swedish group even managed to run a social interaction task to measure social anxiety in a PET scanner – they had the patients make a speech lying down and viewing the audience via a tv screen!